Our Office
-
710, A-Wing, Centrum Business Square, Road No. 16
-
Wagle Estate, Thane (West) 400604, Maharashtra.
Rapid. Robust. Real.
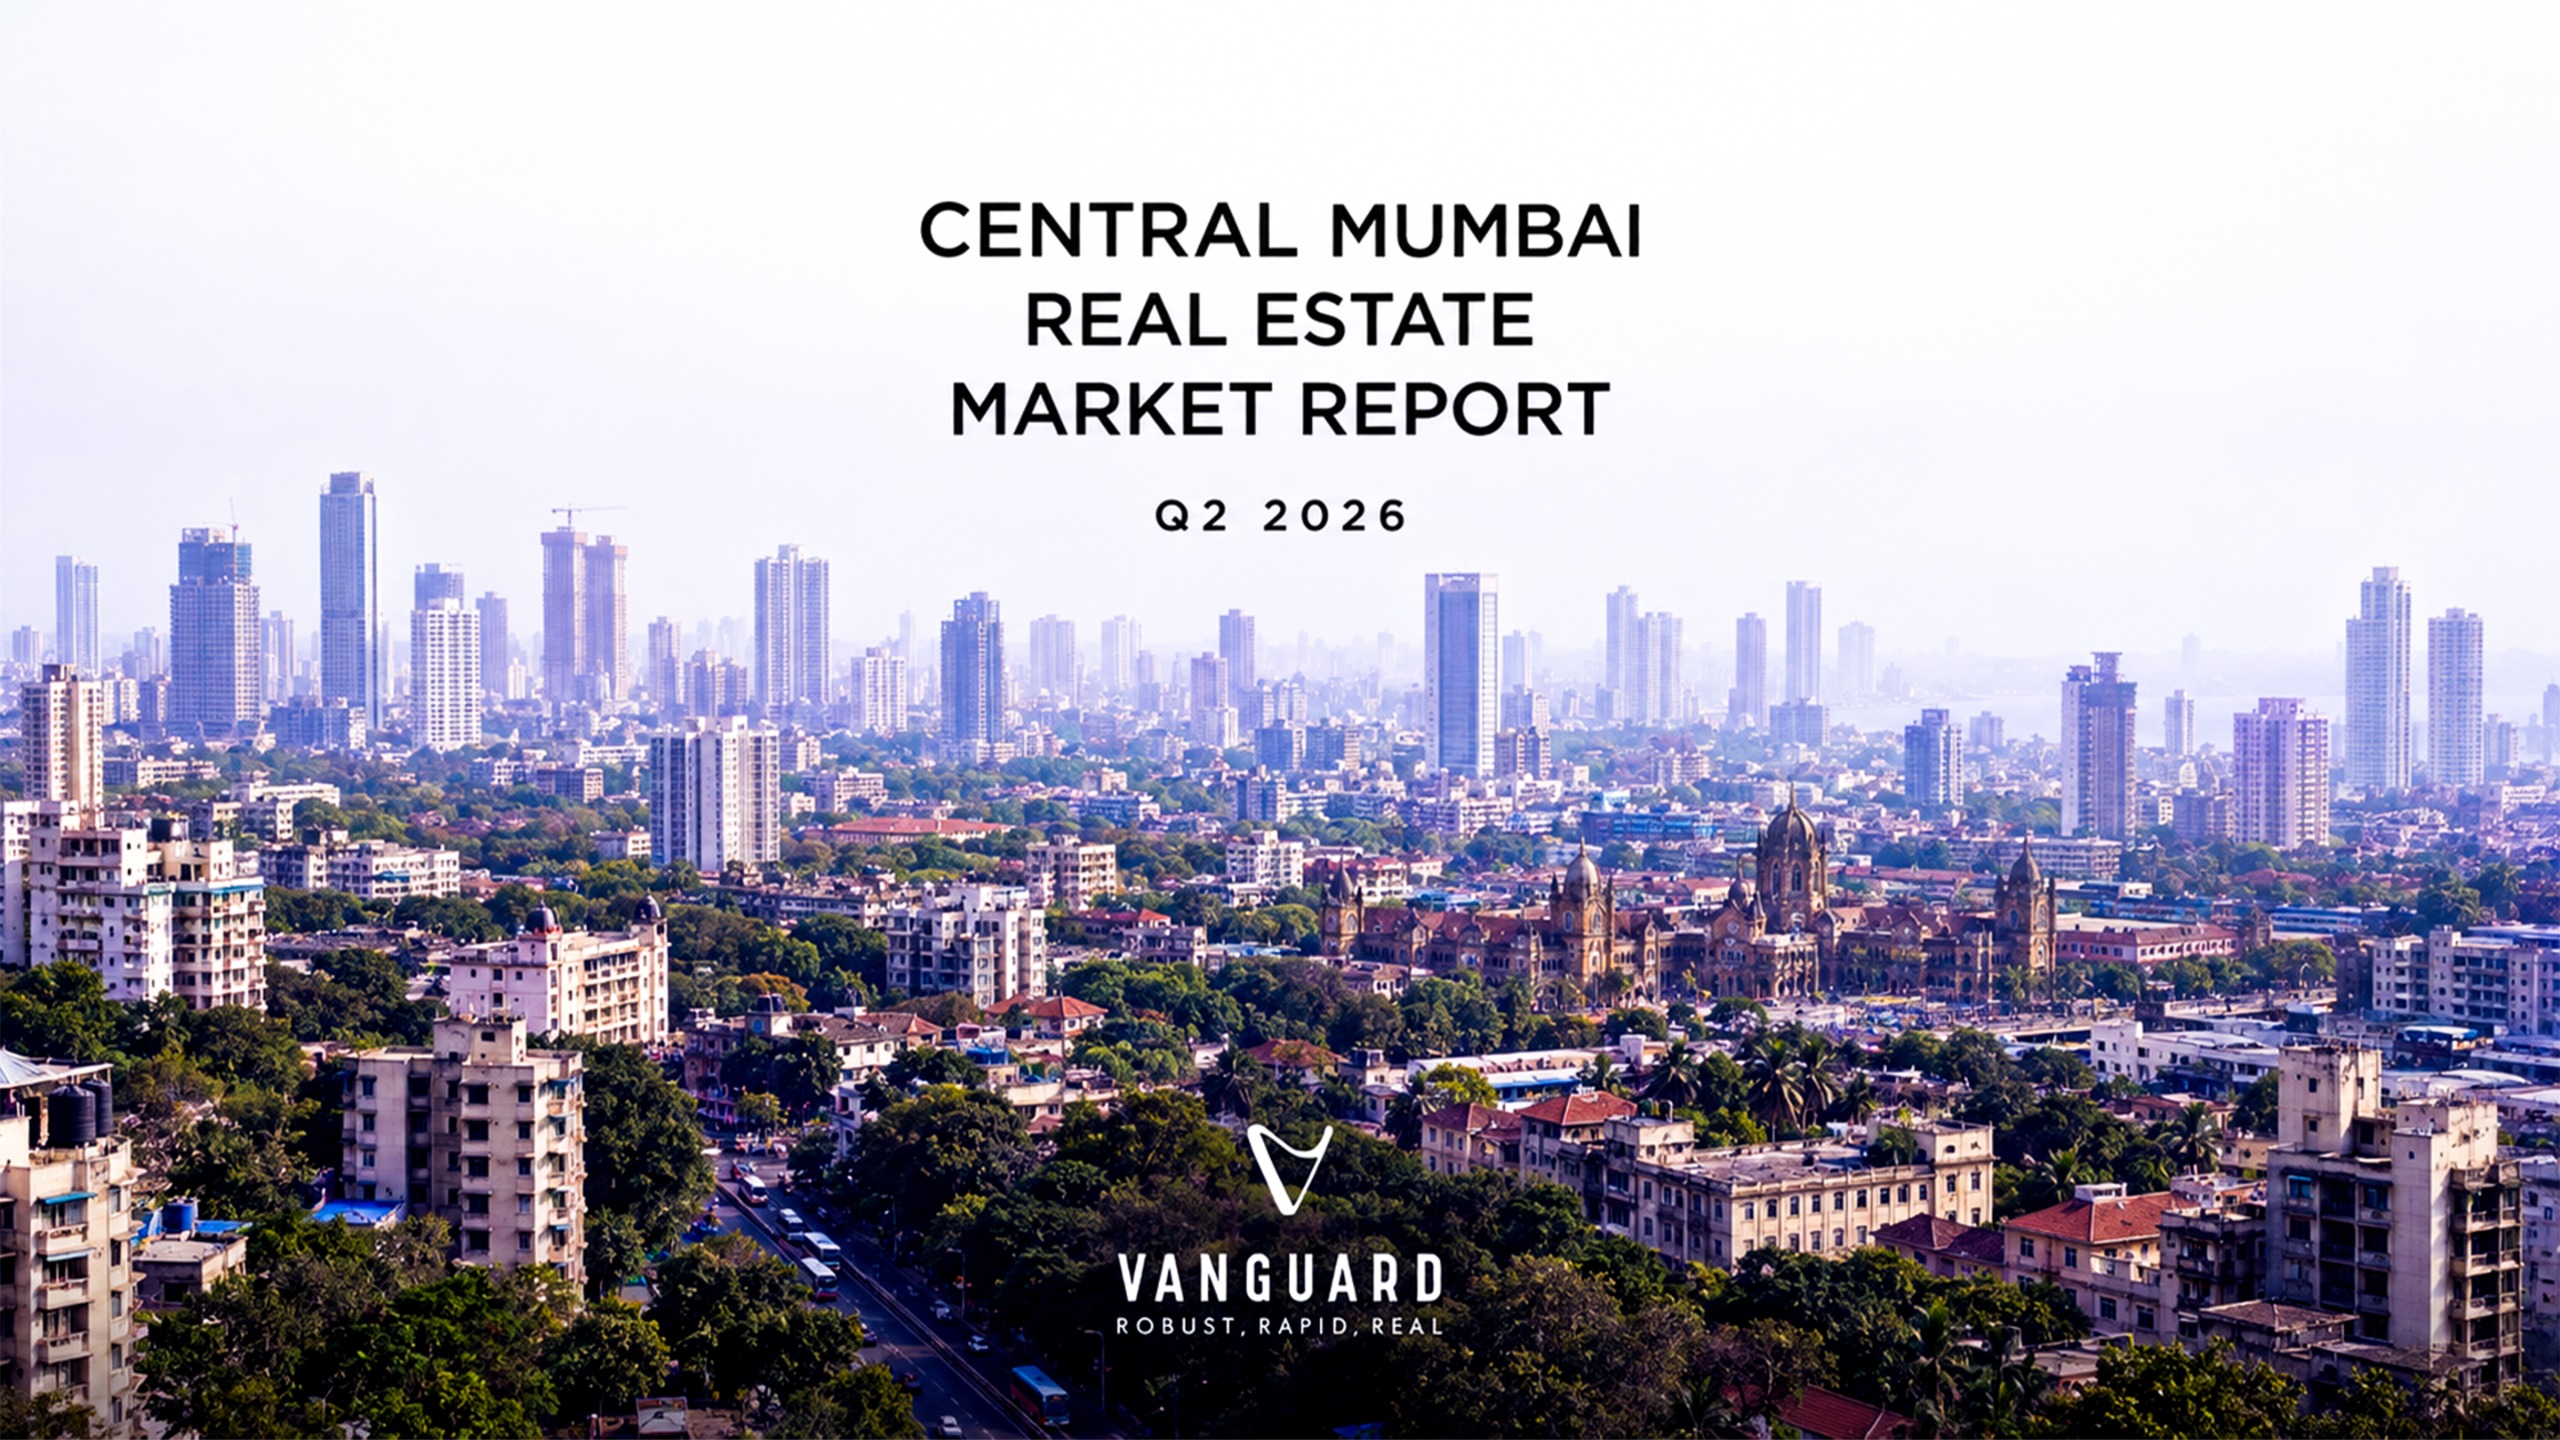
Registration data decoded: ₹1,389 Cr and 468 units across the city's Eastern Corridor
Period covered: April 2026 – June 2026 | Source: Registration office data compiled by IndexTap's HomeBuyer Premier League
Between April and June 2026, the top 10 performing projects across Central Mumbai's Eastern Corridor — Wadala, Sion, Powai, Vikhroli, Kanjurmarg and Mulund — clocked ₹1,389 Cr in registered sales value across 468 units, at a blended average ticket size of ₹2.97 Cr.
But the headline number hides the real story. This quarter, the corridor behaved like two entirely different markets operating on the same railway line — and understanding that split is the difference between a launch that sells and a launch that sits.
Central Mumbai's Eastern Corridor is no longer one market. It is a premium value engine and a mid-market volume engine operating side by side.
All figures below are drawn from registration office data compiled by IndexTap's HomeBuyer Premier League for Q2 FY27 (April–June 2026).
The value leaderboard is where the corridor's premium repositioning shows up most clearly.
| Rank | Project | Micro-Market | Value Registered | Units | Avg. Ticket Size |
|---|---|---|---|---|---|
| 1 | Prestige Forest Hills | Mulund West | ₹208 Cr | 51 | ₹4.08 Cr |
| 2 | Raymond The Address by GS | Wadala | ₹207 Cr | 70 | ₹2.96 Cr |
| 3 | L&T Elixir Reserve | Powai | ₹181 Cr | 56 | ₹3.23 Cr |
| 4 | Lodha Divino | Sion | ₹145 Cr | 31 | ₹4.68 Cr |
| 5 | Hiranandani Rockside | Powai | ₹133 Cr | 11 | ₹12.09 Cr |
| 6 | Oberoi Enigma | Mulund West | ₹126 Cr | 17 | ₹7.41 Cr |
| 7 | Lodha Riservo | Vikhroli West | ₹101 Cr | 45 | ₹2.24 Cr |
| 8 | K Raheja Antares | Kanjurmarg West | ₹96 Cr | 41 | ₹2.34 Cr |
| 9 | Runwal Avenue | Kanjurmarg East | ₹96 Cr | 72 | ₹1.33 Cr |
| 10 | Ajmera Solis | Vikhroli East | ₹96 Cr | 74 | ₹1.30 Cr |
| Total | — | — | ₹1,389 Cr | 468 | ₹2.97 Cr |
Reading between the rows: The top three projects alone account for ₹596 Cr — 42.9% of the entire top-10 value pool. Prestige Forest Hills and Raymond The Address by GS are separated by a single crore, but arrive there through completely opposite routes: Prestige registered ₹208 Cr on just 51 units, while Raymond needed 70 units to reach ₹207 Cr. Same revenue, two different business models.
Flip the ranking to volume, and the leaderboard inverts almost entirely.
| Rank | Project | Micro-Market | Units Sold | Value | Avg. Ticket Size |
|---|---|---|---|---|---|
| 1 | Ajmera Solis | Vikhroli East | 74 | ₹96 Cr | ₹1.30 Cr |
| 2 | Runwal Avenue | Kanjurmarg East | 72 | ₹96 Cr | ₹1.33 Cr |
| 3 | Raymond The Address by GS | Wadala | 70 | ₹207 Cr | ₹2.96 Cr |
| 4 | L&T Elixir Reserve | Powai | 56 | ₹181 Cr | ₹3.23 Cr |
| 5 | Prestige Forest Hills | Mulund West | 51 | ₹208 Cr | ₹4.08 Cr |
| 6 | Lodha Riservo | Vikhroli West | 45 | ₹101 Cr | ₹2.24 Cr |
| 7 | K Raheja Antares | Kanjurmarg West | 41 | ₹96 Cr | ₹2.34 Cr |
| 8 | Lodha Divino | Sion | 31 | ₹145 Cr | ₹4.68 Cr |
| 9 | Oberoi Enigma | Mulund West | 17 | ₹126 Cr | ₹7.41 Cr |
| 10 | Hiranandani Rockside | Powai | 11 | ₹133 Cr | ₹12.09 Cr |
Reading between the rows: The project that topped the value chart drops to 5th on volume. The project that topped the volume chart drops to joint 8th on value. Hiranandani Rockside is the sharpest illustration of all — last on volume, 5th on value, converting just 11 registrations into ₹133 Cr.
The single most important number in this report: the ticket-size spread runs from ₹1.30 Cr to ₹12.09 Cr — a 9.3x gap between the two ends of the same corridor.
Consolidating projects by promoter group changes the pecking order again.
| Rank | Developer | Projects | Value Registered | Share of Value | Units | Share of Units |
|---|---|---|---|---|---|---|
| 1 | Lodha (Macrotech) | Divino, Riservo | ₹246 Cr | 17.7% | 76 | 16.2% |
| 2 | Prestige Group | Forest Hills | ₹208 Cr | 15.0% | 51 | 10.9% |
| 3 | Raymond Realty | The Address by GS | ₹207 Cr | 14.9% | 70 | 15.0% |
| 4 | L&T Realty | Elixir Reserve | ₹181 Cr | 13.0% | 56 | 12.0% |
| 5 | Hiranandani | Rockside | ₹133 Cr | 9.6% | 11 | 2.4% |
| 6 | Oberoi Realty | Enigma | ₹126 Cr | 9.1% | 17 | 3.6% |
| 7= | K Raheja Corp | Antares | ₹96 Cr | 6.9% | 41 | 8.8% |
| 7= | Runwal Group | Avenue | ₹96 Cr | 6.9% | 72 | 15.4% |
| 7= | Ajmera Realty | Solis | ₹96 Cr | 6.9% | 74 | 15.8% |
Reading between the rows: Lodha is the only developer with two projects in the top 10, and that portfolio depth is exactly what puts it at No. 1 — ₹246 Cr and 76 units, without either individual project ranking first on any single metric. Divino works the ₹4.68 Cr band in Sion; Riservo works the ₹2.24 Cr band in Vikhroli. Two price points, one corridor, compounding market share.
Equally telling: Ajmera, Runwal and K Raheja register identical ₹96 Cr each, but convert 74, 72 and 41 units respectively — the same revenue built from three different inventory strategies.
Every single name in the top 10 is a Grade-A, institutionally-backed or listed developer. Not one regional or first-generation builder made the cut this quarter.
Buyer preference in this corridor has consolidated decisively around brand, balance sheet and delivery track record.
| Micro-Market | Value | Share of Value | Units | Share of Units | Avg. Ticket |
|---|---|---|---|---|---|
| Mulund West | ₹334 Cr | 24.0% | 68 | 14.5% | ₹4.91 Cr |
| Powai | ₹314 Cr | 22.6% | 67 | 14.3% | ₹4.69 Cr |
| Wadala | ₹207 Cr | 14.9% | 70 | 15.0% | ₹2.96 Cr |
| Vikhroli (W+E) | ₹197 Cr | 14.2% | 119 | 25.4% | ₹1.66 Cr |
| Kanjurmarg (W+E) | ₹192 Cr | 13.8% | 113 | 24.1% | ₹1.70 Cr |
| Sion | ₹145 Cr | 10.4% | 31 | 6.6% | ₹4.68 Cr |
This table is the clearest evidence of the two-market thesis. Mulund West and Powai together take 46.6% of the value but only 28.8% of the units. Vikhroli and Kanjurmarg together take 49.5% of the units but only 28.0% of the value.
The corridor's revenue engine and its volume engine are in different postal codes.
North of Vikhroli — Mulund West, Powai, Sion — is now a genuine premium market operating at ₹4.5–12 Cr ticket sizes. The Vikhroli–Kanjurmarg belt remains a mid-market volume engine at ₹1.3–2.3 Cr. These are not two ends of one spectrum; they are two separate buyer universes with different income profiles, different funding patterns and different decision cycles. Any developer or marketer treating “Central Mumbai” as a single addressable market this quarter is pricing and positioning against the wrong data.
Two projects, two of India's largest listed developers, ₹334 Cr and the corridor's highest average ticket size at ₹4.91 Cr. Prestige and Oberoi entering the same micro-market simultaneously and both landing in the top six by value is a strong signal of where the corridor's aspirational centre of gravity is shifting.
Mulund is no longer a value alternative to Powai — it is now competing with it on price.
Hiranandani Rockside registered ₹133 Cr from 11 units. Oberoi Enigma registered ₹126 Cr from 17 units. Together, 28 units generated ₹259 Cr — 18.6% of the entire quarter's top-10 value from just 6% of the units. The ultra-luxury buyer in this corridor exists, is transacting, and is completing registrations. The constraint here is supply and positioning, not demand.
Ajmera Solis and Runwal Avenue each matched the ₹96 Cr of K Raheja Antares — with 33 and 31 more units respectively. That's substantially more CRM load, more documentation, more site-visit throughput and more channel-partner coordination for identical topline. In the mid-market band, the win is not in the price point — it's in the sales machinery that can absorb 70+ registrations in 90 days without leaking conversions.
With all ten slots occupied by Grade-A developers, the corridor has effectively repriced trust. For a regional developer, this is not a reason to withdraw — it is a reason to change the playbook. When you cannot outspend a listed developer on brand, you outperform them on micro-market penetration, launch velocity and transparency. That is precisely the gap a specialist mandate partner is built to close.
If you're a developer with land or a launch in this corridor: your pricing band determines your entire go-to-market, not the other way round. A ₹1.3 Cr product and a ₹4.9 Cr product in the same corridor need different media mixes, different channel structures, different sample-flat investments and different sales team profiles. The Q2 data gives you the benchmark to price against; the execution has to be built backwards from that number.
If you're a homebuyer: the corridor is offering genuine optionality right now. The same Central line that connects you to Wadala at ₹2.96 Cr connects you to Kanjurmarg at ₹1.33 Cr. With infrastructure maturing across the corridor, entering the volume belt today is a position that the premium belt's trajectory suggests is worth taking seriously.
If you're an investor: track the Mulund West and Powai average ticket sizes over the next two quarters. If the ₹4.7–4.9 Cr band holds through Q3, the Vikhroli–Kanjurmarg belt has a clear appreciation runway behind it.
Numbers on a registration chart are a scoreboard. They tell you who won last quarter. They don't tell you how.
At Vanguard Ventures, we read this data the way a sales mandate partner has to — as a map of where demand actually converted, at what price, at what velocity, and what it took to get there. That is what our three pillars are built for:
Planning a launch in Central Mumbai's Eastern Corridor? Let's talk about where your project sits on this chart — and where it should sit next quarter.
Vanguard Ventures | Wagle Estate, Thane (W)
Sales & Marketing Mandates |
Real Estate Consulting | Brand & GTM Strategy
*Data source: Registration office records compiled by IndexTap, HomeBuyer Premier League — Mumbai, April 2026 to June 2026. Analysis and commentary by Vanguard Ventures. This report is indicative and not intended as professional or financial advice.