
Our Office
-
710, A-Wing, Centrum Business Square, Road No. 16
-
Wagle Estate, Thane (West) 400604, Maharashtra.
Rapid. Robust. Real.
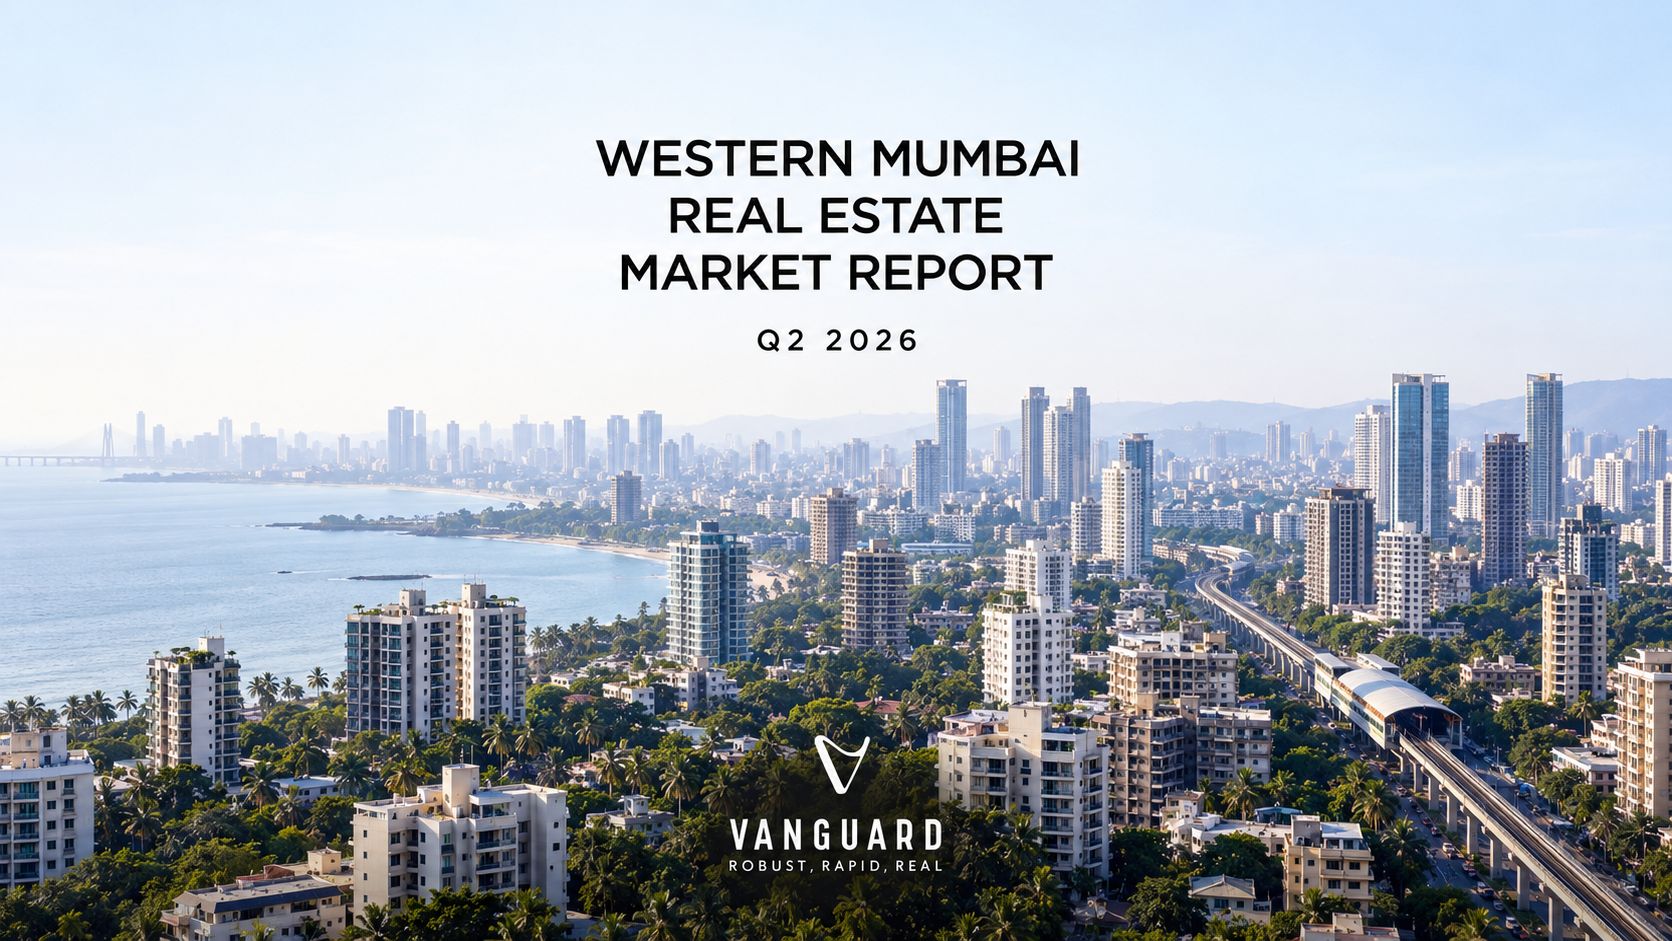
What the registration data tells us about the Western Suburbs' strongest-selling projects, the developers behind them, and where the demand is really sitting.
Period covered: April 2026 – June 2026 | Source: HomeBuyer Premier League / IndexTap, with macro registration context from Knight Frank India
Q2 2026 (April–June) closed on a firm note for Mumbai's residential market. Knight Frank India's analysis of registration data showed Mumbai recording 80,221 property registrations in the first half of 2026 — the city's strongest first-half performance since 2013, contributing ₹6,968 crore to the state exchequer and marking a 6% year-on-year increase.
Within the quarter itself, April 2026 alone saw over 13,800 registrations, the strongest April in over a decade, while May recorded 12,315 transactions, the highest May figure in 14 years, and June was expected to close at 13,302 registrations, up 15% year-on-year and the highest June in 14 years.
The Western Suburbs remain the engine of this volume. Region-wise, the Western and Central Suburbs together continue to command roughly 85% of Mumbai's total registered market share, and the Western Suburbs held an average asking price of around ₹34,900 per sq. ft. through this period.
Against that backdrop, the Top 10 registered projects in the Western Suburbs for Q2 2026 delivered:
| Metric | Q2 2026 (Top 10) |
|---|---|
| Total value registered | ₹2,267 Cr |
| Total units registered | 438 units |
| Blended average ticket size | ₹5.18 Cr |
| Share held by top 3 projects | 47.2% of value |
The Western Suburbs are not moving as one market. Q2 shows a sharp barbell: high-volume mid-premium corridors at one end and deep-ticket ultra-luxury addresses at the other.
| Rank | Project | Micro-Market | Value Registered | Units | Avg. Ticket Size |
|---|---|---|---|---|---|
| 1 | Oberoi Elysian | Goregaon East | ₹488 Cr | 35 | ₹13.94 Cr |
| 2 | Oberoi Sky City | Borivali East | ₹299 Cr | 51 | ₹5.86 Cr |
| 3 | Godrej Reserve | Kandivali East | ₹282 Cr | 55 | ₹5.13 Cr |
| 4 | Mahindra Marina64 | Malad West | ₹227 Cr | 72 | ₹3.15 Cr |
| 5 | Purva Estrella | Andheri West | ₹209 Cr | 43 | ₹4.86 Cr |
| 6 | Hiranandani Bay Heights | Bandra West | ₹177 Cr | 15 | ₹11.80 Cr |
| 7 | The Address By GS | Bandra East | ₹152 Cr | 53 | ₹2.87 Cr |
| 8 | Mahindra Vista | Kandivali East | ₹149 Cr | 62 | ₹2.40 Cr |
| 9 | K Raheja Valletta | Juhu | ₹142 Cr | 6 | ₹23.67 Cr |
| 10 | Shapoorji Pallonji Nine Arcs | Santacruz East | ₹142 Cr | 46 | ₹3.09 Cr |
The leaderboard reorders significantly when ranked by volume rather than value — which is where the real absorption story sits.
| Rank | Project | Micro-Market | Units | Value Registered | Movement vs. Value Rank |
|---|---|---|---|---|---|
| 1 | Mahindra Marina64 | Malad West | 72 | ₹227 Cr | ▲ 3 |
| 2 | Mahindra Vista | Kandivali East | 62 | ₹149 Cr | ▲ 6 |
| 3 | Godrej Reserve | Kandivali East | 55 | ₹282 Cr | — |
| 4 | The Address By GS | Bandra East | 53 | ₹152 Cr | ▲ 3 |
| 5 | Oberoi Sky City | Borivali East | 51 | ₹299 Cr | ▼ 3 |
| 6 | Shapoorji Pallonji Nine Arcs | Santacruz East | 46 | ₹142 Cr | ▲ 4 |
| 7 | Purva Estrella | Andheri West | 43 | ₹209 Cr | ▼ 2 |
| 8 | Oberoi Elysian | Goregaon East | 35 | ₹488 Cr | ▼ 7 |
| 9 | Hiranandani Bay Heights | Bandra West | 15 | ₹177 Cr | ▼ 3 |
| 10 | K Raheja Valletta | Juhu | 6 | ₹142 Cr | ▼ 1 |
The headline divergence: Oberoi Elysian ranks No. 1 by value but only No. 8 by volume. Mahindra Marina64 ranks No. 1 by volume but only No. 4 by value. Two entirely different business models are winning the same quarter.
When the leaderboard is rolled up to the developer level, the concentration becomes clear.
| Developer | Projects in Top 10 | Value Registered | Share of Value | Units | Share of Units | Avg. Ticket Size |
|---|---|---|---|---|---|---|
| Oberoi Realty | 2 — Elysian, Sky City | ₹787 Cr | 34.7% | 86 | 19.6% | ₹9.15 Cr |
| Mahindra Lifespaces | 2 — Marina64, Vista | ₹376 Cr | 16.6% | 134 | 30.6% | ₹2.81 Cr |
| Godrej Properties | 1 — Godrej Reserve | ₹282 Cr | 12.4% | 55 | 12.6% | ₹5.13 Cr |
| Puravankara | 1 — Purva Estrella | ₹209 Cr | 9.2% | 43 | 9.8% | ₹4.86 Cr |
| Hiranandani | 1 — Bay Heights | ₹177 Cr | 7.8% | 15 | 3.4% | ₹11.80 Cr |
| Raymond Realty | 1 — The Address By GS | ₹152 Cr | 6.7% | 53 | 12.1% | ₹2.87 Cr |
| K Raheja Corp Homes | 1 — Valletta | ₹142 Cr | 6.3% | 6 | 1.4% | ₹23.67 Cr |
| Shapoorji Pallonji | 1 — Nine Arcs | ₹142 Cr | 6.3% | 46 | 10.5% | ₹3.09 Cr |
Two developers — Oberoi Realty and Mahindra Lifespaces — account for 51.3% of the value and 50.2% of the units in the entire Top 10. That is an unusually tight concentration for a market as fragmented as the Western Suburbs.
| Micro-Market | Value Registered | Units | Avg. Ticket Size |
|---|---|---|---|
| Kandivali East | ₹431 Cr | 117 | ₹3.68 Cr |
| Goregaon East | ₹488 Cr | 35 | ₹13.94 Cr |
| Bandra (E + W) | ₹329 Cr | 68 | ₹4.84 Cr |
| Borivali East | ₹299 Cr | 51 | ₹5.86 Cr |
| Malad West | ₹227 Cr | 72 | ₹3.15 Cr |
| Andheri West | ₹209 Cr | 43 | ₹4.86 Cr |
| Juhu | ₹142 Cr | 6 | ₹23.67 Cr |
| Santacruz East | ₹142 Cr | 46 | ₹3.09 Cr |
Kandivali East is the volume capital of the quarter — 117 units across two projects, 26.7% of all units in the Top 10, from just 19% of the value. Goregaon East is the value capital, generating the single largest value contribution from only 35 registrations.
At one end sit K Raheja Valletta (₹23.67 Cr average) and Hiranandani Bay Heights (₹11.80 Cr average) — 21 units between them generating ₹319 Cr. At the other end sit Mahindra Vista (₹2.40 Cr), The Address By GS (₹2.87 Cr) and Nine Arcs (₹3.09 Cr) — 161 units generating ₹443 Cr. Roughly the same money, eight times the customers. There is no single “Western Suburbs buyer” anymore; there are two, and they need entirely separate sales machinery.
Six registrations at K Raheja Valletta produced ₹142 Cr — the same value as 46 registrations at Nine Arcs. A single Juhu transaction is worth roughly ten Kandivali transactions. For developers sitting on small, high-value land parcels in Juhu, Bandra West or Pali Hill, this quarter validates the thin-inventory, deep-ticket model. Luxury registrations above ₹5 crore now account for about 7% of total MMR registrations — small in count, disproportionate in value.
Marina64, Vista, The Address By GS and Nine Arcs — all clustered between ₹2.40 Cr and ₹3.15 Cr average — together delivered 233 of the 438 units, or 53% of all volume in the Top 10. This mirrors what the broader market is showing: the ₹1–2 crore segment has grown to 38% of all registrations in H1 2026, up from 32% a year earlier, driven by salaried buyers wanting quality mid-size apartments and by new launches from reputed developers aimed squarely at this band.
If a developer wants monthly absorption numbers rather than quarterly headlines, this is the band to price into.
Every single project in the Top 10 belongs to an organised, listed or institutionally-backed developer — Oberoi, Mahindra, Godrej, Puravankara, Hiranandani, Raymond, K Raheja, Shapoorji Pallonji. Not one independent or unbranded developer made the list.
In a market where Western Suburbs asking prices have reached roughly ₹34,900 per sq. ft., buyers are paying a visible premium for delivery certainty. For regional developers, this is the competitive reality to plan around: the answer is not to out-spend the national brands, but to out-position them within a defined micro-market.
Kandivali East (117 units), Malad West (72 units) and Borivali East (51 units) together account for 240 units — 55% of the Top 10 volume. The North-Western belt, supported by Metro Line 2A/7 connectivity, Link Road infrastructure and large-format township supply, is now absorbing more households per quarter than the entire Bandra–Juhu–Santacruz premium belt combined.
Township-scale execution beats single-tower launches on velocity, decisively.
For developers: Q2 confirms that the winning formula is either scale with a sharp mid-premium price point, or scarcity with a genuine ultra-luxury address. The uncomfortable middle — a ₹6–8 Cr ticket in a non-marquee location — is where inventory ages. Any launch planned for the festive quarter should be stress-tested against this before the price sheet is frozen.
For homebuyers: A robust new supply pipeline is maintaining buyer choice while creating competitive pressure on developers to offer incentives — particularly on under-construction projects, where payment-plan flexibility and early-booking discounts are negotiable. The next two quarters carry the festive season, which historically compresses available stock in the fastest-moving configurations.
For channel partners and mandate teams: 438 registrations across ten projects means the top of the market is narrow and winnable. A well-structured micro-market penetration plan can put a mid-sized developer on this leaderboard within two quarters. Concentration cuts both ways.
This leaderboard is a registration record, not a marketing claim — and that is precisely why it is worth studying. Every number here represents a completed transaction at the sub-registrar's office.
At Vanguard Ventures, we read this data the way we build every mandate:
If you are planning a Western Suburbs launch for Q3 or Q4 2026 and want a micro-market positioning and velocity plan built on this data, our mandate team is available for a working session.
Vanguard Ventures | Real Estate Mandate Sales & Marketing | Wagle Estate, Thane (W)
*Data source: HomeBuyer Premier League — Mumbai Western Suburbs, April 2026 to June 2026, compiled by IndexTap from Maharashtra sub-registrar registration records. Macro registration figures sourced from Knight Frank India's analysis of Maharashtra IGR data. Rankings reflect the Top 10 registered projects only and do not represent the total Western Suburbs market. This analysis is indicative and should not be construed as professional or financial advice.